Appearance
Performance, Scalability, and Capacity
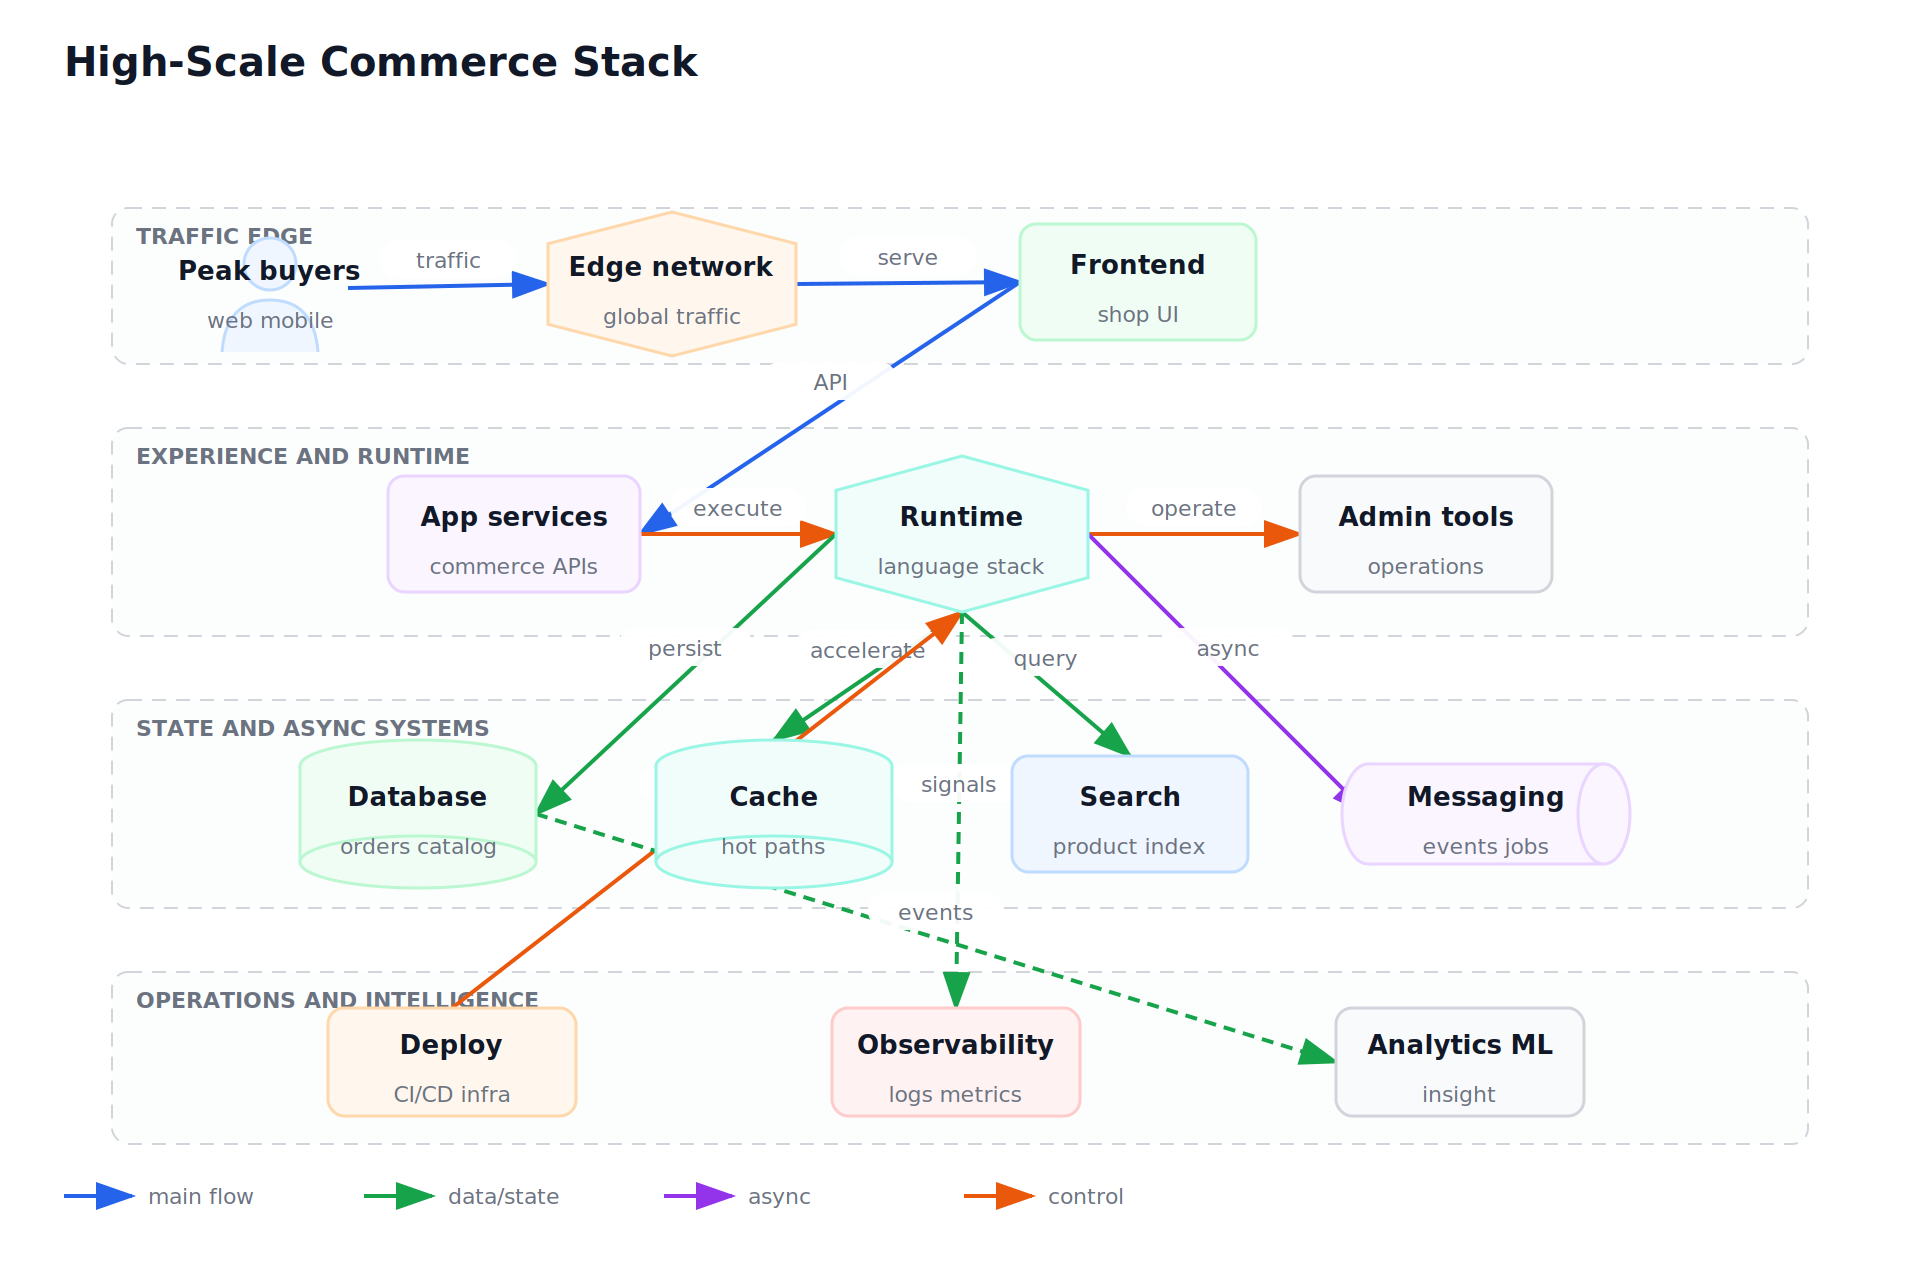
Performance, Scalability, and Capacity Graphics Coverage
Primary chapter graphic: High-Scale Commerce Stack. Accepted graphics: 1. Reviewed non-signal pages: 0. Open graphics in review: 0. QA status lives in graphics audit and visual review ledger.
Corpus pages: p. 22-23, p. 115, p. 198, p. 249, p. 359 Coverage: 6 pages; low-confidence extraction ranges: p. 22-23, p. 359
This chapter is part of Marius's owned architecture build corpus. The text routes decisions; durable implementation signal is carried by accepted graphics, reviewed non-signal decisions, and the linked QA audit.
Chapter Visuals
Accepted graphics carry the canonical design signal for this chapter. Each selected source page is either accepted as a graphic or explicitly marked non-signal in the source-faithful ledger. Review and QA state live in visual inventory, visual review ledger, and graphics audit.
High-Scale Commerce Stack
- source-page: p. 198
- batch: 37
- status: accepted
- reviewer-status: reviewed
- fidelity-score: 0.9
- spec: bbg-p0198-performance-scalability-and-capacity-performance.json
- svg: bbg-p0198-performance-scalability-and-capacity-performance.svg
Open Review Queue
- none
Reviewed Non-Signal Pages
- none
Use When
- The system must handle more users, data, requests, or jobs without degrading trust.
Avoid When
- No measurement shows pressure yet and complexity would slow delivery.
Core Model
- Scalability is repeated capacity expansion without changing the user promise.
- Prefer explicit ownership over accidental coupling. Every boundary should say who owns correctness, cost, data, recovery, and change.
- Use corpus page pointers for inspection, and keep the chapter notes focused on reusable design decisions.
Implementation Guidance
- Find the bottleneck, define the target, then choose vertical scaling, horizontal scaling, caching, partitioning, or async work.
- Write the smallest useful design note: purpose, inputs, outputs, state, failure behavior, observability, and rollback.
- Choose the first implementation that can be tested against the real workflow without hiding a known production risk.
Tradeoffs
- Horizontal scaling adds coordination costs; vertical scaling can delay but not remove architectural limits.
- Centralization reduces duplicated work but can become a bottleneck when every team needs exceptions.
- Specialized infrastructure helps at scale, but it must earn its operational cost.
Failure Modes
- Average latency improves while tail latency still breaks the workflow.
- The diagram shows boxes but not ownership, retry behavior, data freshness, or user-visible failure.
- The system has no proof path for the highest-risk assumption.
Decision Checklist
- Measure p50, p95, p99, saturation, queue age, error rate, and cost per unit of work.
- Name the owner, source of truth, timeout, retry policy, and evidence that the path works.
- Add one regression check for the failure mode most likely to recur.
Neutral Automation Examples
- A rendering service moves slow jobs to a worker pool and scales workers from queue depth.
- A neutral internal automation starts with fixtures, then adds credentials, permissions, and production scheduling only after the boundary is tested.
- A customer-facing workflow keeps irreversible actions behind explicit approval until metrics show it is safe to automate further.